Indoor Navigation - An approach with Wi-Fi Fingerprints
At the end of 2018, I finally finished my graduation thesis on computer engineering. The main objective was to create something that encapsulates math, software, and hardware. During my course, my college professors always encouraged the students to develop some kind of critical view, about how a computer engineer could improve the world around it. I always wanted to build something that could be used to help someone, even in a minimal way.
The idea for my graduation thesis began when I noticed something, although my college had proper braille signs identifying each classroom and bump dots everywhere, blind people still need a companion to reach their destinations. My idea was to create a way to allow blind people to reach their destinations by themselves.
How to do indoor navigation?
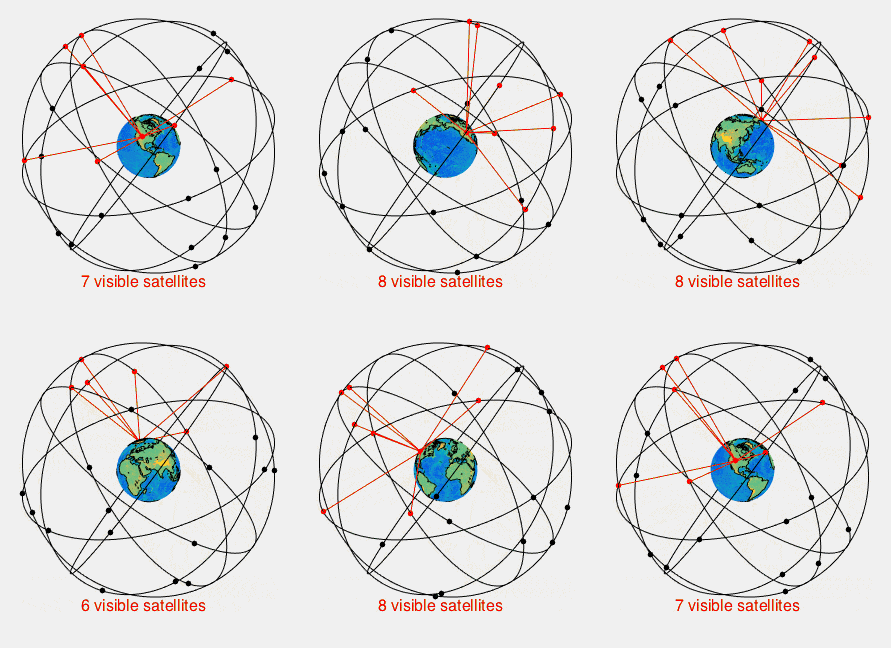
When we think about this kind of navigation assistance we often think about GPS (Global Positioning System), but it turns out that GPS is not good for indoor navigation, satellites just can’t offer this precision because the structure of the building often blocks the signal.

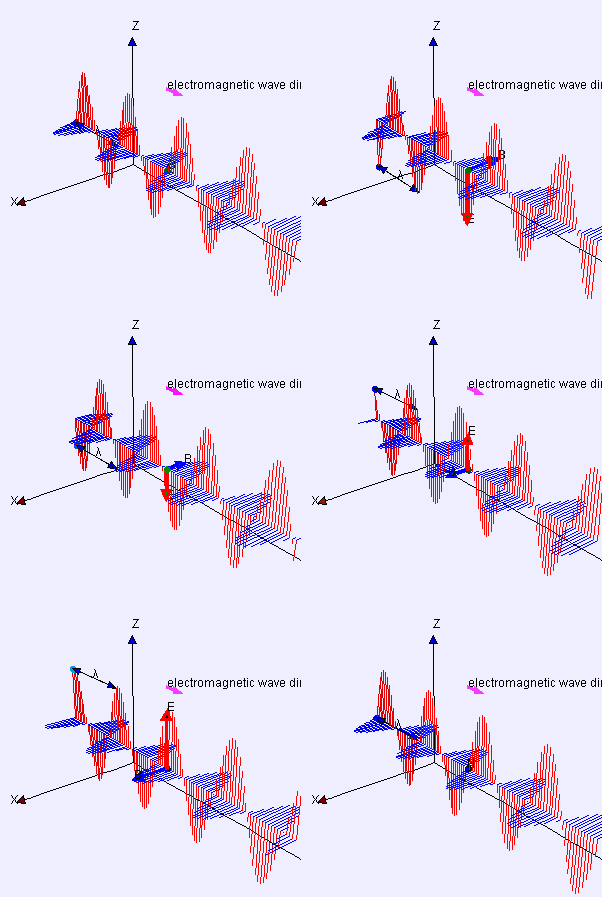
So I needed another way to track someone inside the college, and the wireless technology came to the rescue. My college building was filled up with routers at every corner. Here begins the fun part, there is a technique of indoor navigation called Wi-Fi Fingerprint, and the concept behind it’s very interesting. It’s important to keep in mind that a wireless signal is just electromagnetic radiation.
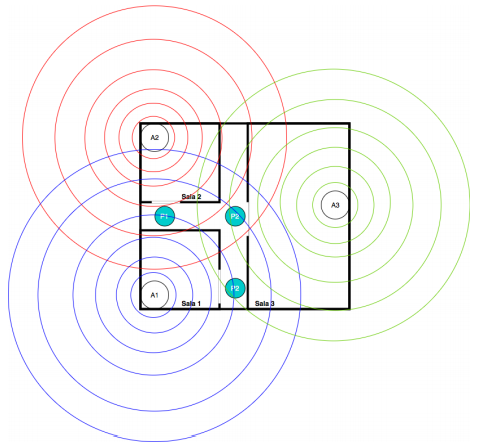
In the image above, the Wi-FI Fingerprints are the composition of the RSSI (received signal strength indication) of the three access points (A1, A2, A3) and each point (P1, P2, P3) has it’s own fingerprint because they are in different points in a three-dimensional space. Even at the same point, the new fingerprint is not the same as before but it’s ideally close (remember the signals are varying in time).


So, now it was possible to create unique identifiers based on our access points RSSI. But a new problem arose from this, how to compare them? The first approach to this was to compare Wi-Fi Fingerprints using Euclidian and Manhattan Distances. Those methods were not enough, two fingerprints measured in the same place with milliseconds of difference were very different, I needed a more reliable way of comparing those fingerprints.
What about Machine Learning techniques?
What I needed was a way of embrace those differences betweens Wi-FI Fingerprints for the same point. So I started to research machine learning, the idea was to train a model with lots of Wi-Fi Fingerprints measured for lots of different points.
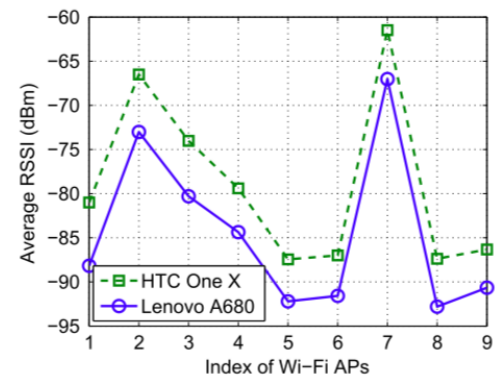
It’s important to note that different devices measure different Wi-Fi Fingerprints (as demonstrated in the image above from the article Wi-Fi Fingerprint-Based Indoor Positioning), so standardize a device was important, and remember that hardware was requisite, I could not use something that was already finished. For now, I will just state that I chose the Raspberry Pi Zero W because it had Wi-FI capabilities built-in and was powerful enough to run the applications I needed.
Data
According to the book Artificial Intelligence: A Modern Approach,
Throughout the 60-year history of computer science, the emphasis has been on the algorithm as the main subject of study. But some recent work in AI suggests that for many problems, it makes more sense to worry about the data and be less picky about what algorithm to apply.
I needed lots of data in order to create good models. The process of gathering all this Wi-Fi Fingerprints data is called "site-survey". A lot of studies show that your data becomes “old” and a new site-survey was necessary at some point.
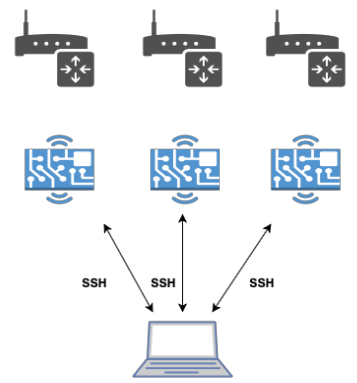
The idea was to collect Wi-Fi Fingerprints for each point (where each point was a classroom at my college). To do this, I used three Raspberry boards with a custom Wi-Fingerprint collector CLI tool developed by me and a MongoDB to store all fingerprints. It was a long process, collect all Wi-Fi Fingerprints for the points we needed (thousands of fingerprints for each point). After each collect process, I exported the data from MongoDB as JSON and recovered from the boards via scp. The image above illustrates how this process worked.
How does a Wi-Fi Fingerprint looks like?
[
  {
    "macAddress": "24:79:2A:BD:AB:58",
    "RSSI": -72
  },
  {
    "macAddress": "24:79:2A:3D:C5:98",
    "RSSI": -44
  },
  {
    "macAddress": "24:79:2A:BD:C5:98",
    "RSSI": -55
  }
]
A Wi-Fi Fingerprint was a simple list of objects where each object represents a wireless network containing the unique device identifier (Mac Address) and it’s RSSI respective value.
The dataset

The image above shows the final result, and how much Wi-Fi Fingerprints I initially collected for each point. This dataset was used to train the machine learning models.
The machine learning model
Three key concepts are needed to be understood here. I will not enter into details about what models I did use or how to use them, but there are great books that could teach you. Doing this would take another extensive post.
- Classification
- Binary classification
- Multiclass classification
Classification
Classification is a model of supervised learning. In this model, the objective is to identify a class (also named as a label) based on input data. If you think about it, this is exactly what we want, to determine which point we are based on a Wi-Fi Fingerprint. Classification is divided into two groups, Binary classification, and Multiclass classification.
Binary Classification
In Binary Classification we have two classes, a positive and a negative class. We can return to our Wi-Fi Fingerprint problem, with the Binary Classification we can say if a fingerprint belongs to a point.
Multiclass Classification
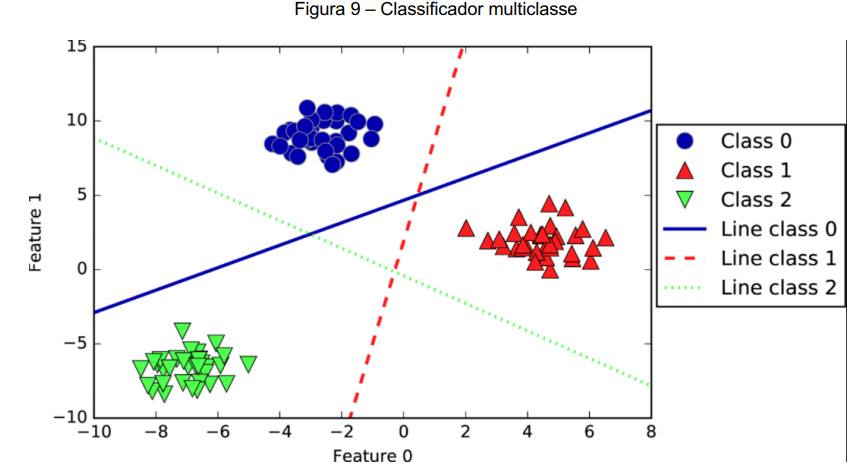
Binary Classification is excellent to determine if a Wi-Fi Fingerprint belongs to a point (class). But our real problem is that we have lots of different classrooms (also known as points and also known as classes) at the college. There are lots of ways to implement a Multiclass Classification but one famous way is using the “One vs. All” technique. In this method, a set of binary classifiers are created (one for each class) and the input data is executed through all those classifiers, the classification that responds with the best confidence is chosen as the right one.
A Multiclass Classification was exactly what I needed. Given input data (also known as Wi-Fi Fingerprint) my model would respond to me what is the most likely class (or point/classroom at college I was on).
The hardware prototype
Schematics
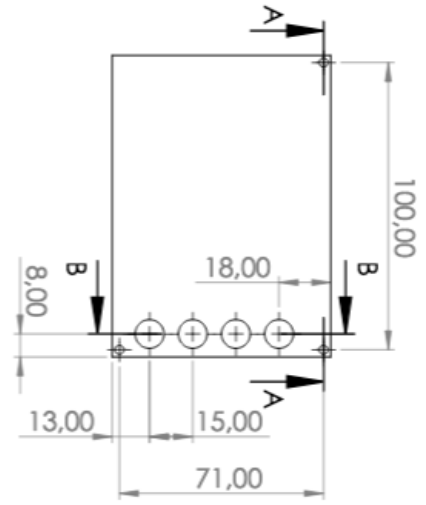
From the schematics drawings above a 3D version was made an then I used a 3D printer.
The prototype
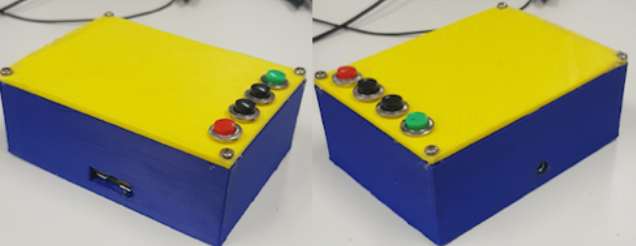
The main idea was built something very easy to use, you just need to plug your headphones to start using it.
How we define a route between the current position and the destination
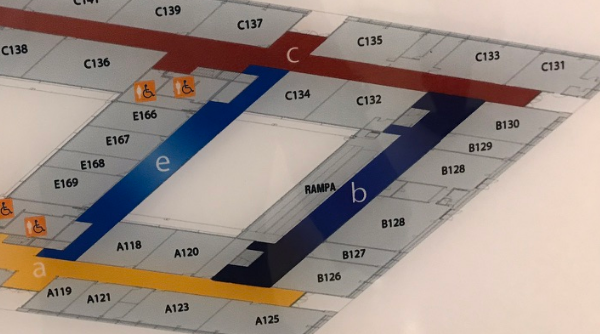
The image above is a photo of the college map. This photo shows all classrooms (in codes like “A120”) and how they are connected. At this point, I had the almost all info I needed to build my map, the questions were, how to structure this data to be used by software?
Graphs

Graphs are a way to structure our data, here the important part is the relationship between our data. The image above is a graph representation of the classrooms I considered for my proof of concept. If we think about going from point A to point B, there is no way to reach the destination without pass by all points in between (unless you teleport yourself). This was kind of what I needed to inform users about their next step towards their destination. The good part is that Graph theory it’s something very established, there are a lot of algorithms developed to perform a search inside a graph no matter the size.
How the navigation works
The idea was to build a portable device using the Raspberry Pi board. This device could be used by someone who is blind via an audio interface.
The steps are described bellow:
- User chooses a classroom as destination
- The device captures the Wi-FI Fingerprint for the current position
- The device calculates a route between the current classroom and the destination classroom
- The device gives an intruction to the user via audio
- The device starts a process of verifying the current Wi-Fi Fingerprint in order to give to the user the next instruction
The project itself
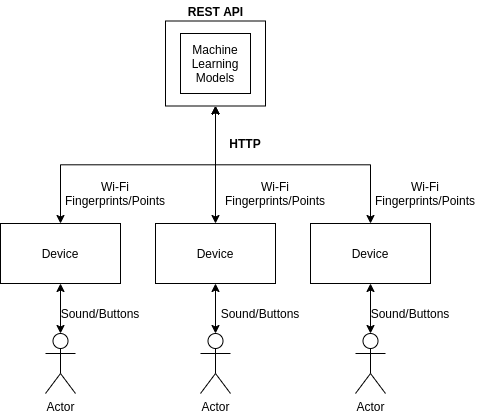
I had never used Machine Learning for anything before and had a pretty short schedule to finish my project. So I started with Python and it’s library Sklearn. At some point, I encountered problems in executing a Sklearn model trained in a powerful machine in a Raspberry. And it’s also important to remember that even if I were able to execute it, a Raspberry Pi has very limited resources. So I went for a model where the devices were constantly consulting an external REST API via HTTP. The image above it’s a schematic representing the devices and the REST API.
Final considerations
This was by far the most ambitious project I ever did by myself. The amount of search I did in areas that I had never seen before was huge. But looking back was worthy because it was the first time I experienced some problems like the need for a data pipeline. I was working with 3 Raspberry boards saving data collected as JSON. I needed to merge all this data and convert it into a tabular format to train my machine learning models. Only the site-survey process took a very long time, but I was able to collect 258.369 Wi-Fi Fingerprints in total (not all were used in the dataset because I limited the classrooms).
The project was an academic success although it had flaws like I wasn’t able to separate the college access points apart from other wireless devices from people at college passing by (I realized after that there were ways of doing that). The algorithm responsible for guiding the user could be improved a lot.
The idea was to show some of the work I did, and I hope it could be a starting point for others. You can find my GitHub repository for this project here, there you can find even Amazon S3 links where I uploaded all my data. You can also find my thesis here (it’s in Brazilian Portuguese) where I describe in detail what was done in each part and also list every article or book used for research.
Hope you enjoy ;)